Plotting Protein Distribution
from pyXLMS import __version__

print(f"Installed pyXLMS version: {__version__}") Installed pyXLMS version: 1.3.0from pyXLMS import parser
from pyXLMS import plottingAll plotting functionality is available via the plotting submodule. We also import the parser submodule here for reading result files.
parser_result = parser.read(
    "../_data/20220215_Eclipse_LC6_PepMap50cm-cartridge_mainlib_DSSO_3CV_stepHCD_OT_001.pdResult",
    engine="MS Annika",
    crosslinker="DSS",
) Reading MS Annika CSMs...: 100%|██████████████████████████████████████████████████████████████████████████████████████████████████| 6324/6324 [00:00<00:00, 11030.92it/s]
Reading MS Annika crosslinks...: 100%|████████████████████████████████████████████████████████████████████████████████████████████| 3025/3025 [00:00<00:00, 22489.35it/s]We read crosslink-spectrum-matches and crosslinks using the generic parser from a single .pdResult file.
fig, ax = plotting.plot_protein_distribution(
    parser_result["crosslink-spectrum-matches"],
    figsize=(15.0, 5.0),
    filename_prefix="protein_dist_csms",
)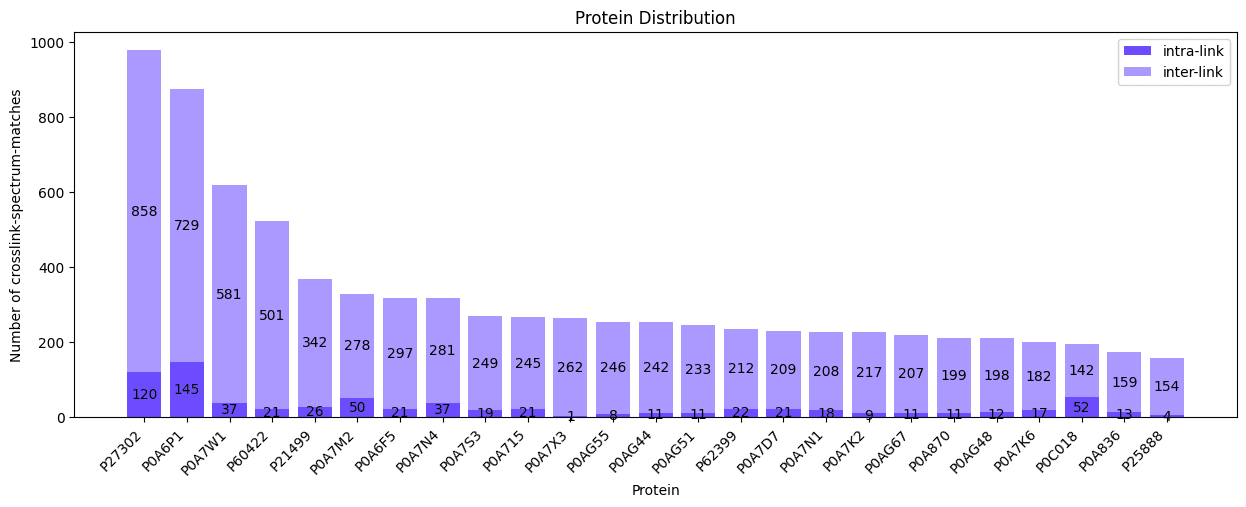
We can plot the protein distribution for our crosslink-spectrum-matches by passing them as the first argument.
Please note that plotting a protein distribution is only possible if all data have a associated alpha and beta proteins, otherwise the function will raise an exception!
The default figure size is 16 by 9 inches and does not need to be set explicitly, we just used a smaller one here for demonstration purposes. The filename_prefix parameter is also optional, if it is given the plot is saved four times: once without the title in .png and .svg format, and once with the title in .png and .svg format.
fig, ax = plotting.plot_protein_distribution(
    parser_result["crosslinks"],
    top_n=10,
    title="Top 10 Proteins",
    figsize=(7.0, 4.0),
)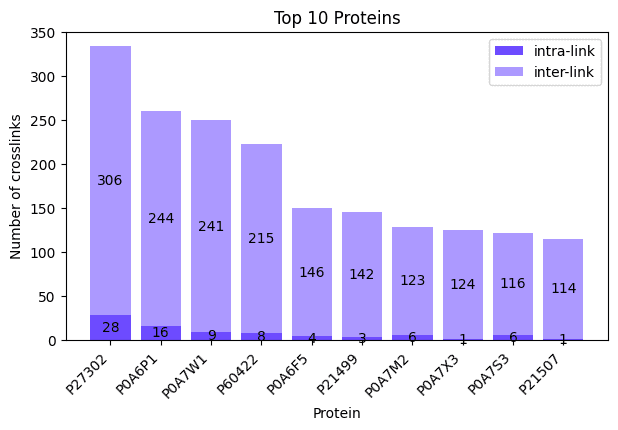
We can do the same plot for our crosslinks by passing them as the first argument instead. This time we also specify top_n=10 to control the number of proteins in our plot and additionally specify a title via the title parameter. Since we did not specify a filename_prefix the plot is not saved to disk. There are also other parameters that can be set to tune your plot like colors, you can read more about all the possible parameters here: docs.