Visualizing Results
The Visualize tab will show some basic plots for your CSMs and/or XLs and/or
aggregated XLs.
Note
Please note that the visualizations are heavily influenced by your pre-processing
and filtering steps! E.g. filtering for target matches will obviously mean that
Target and Decoy plots will only show target-target matches!
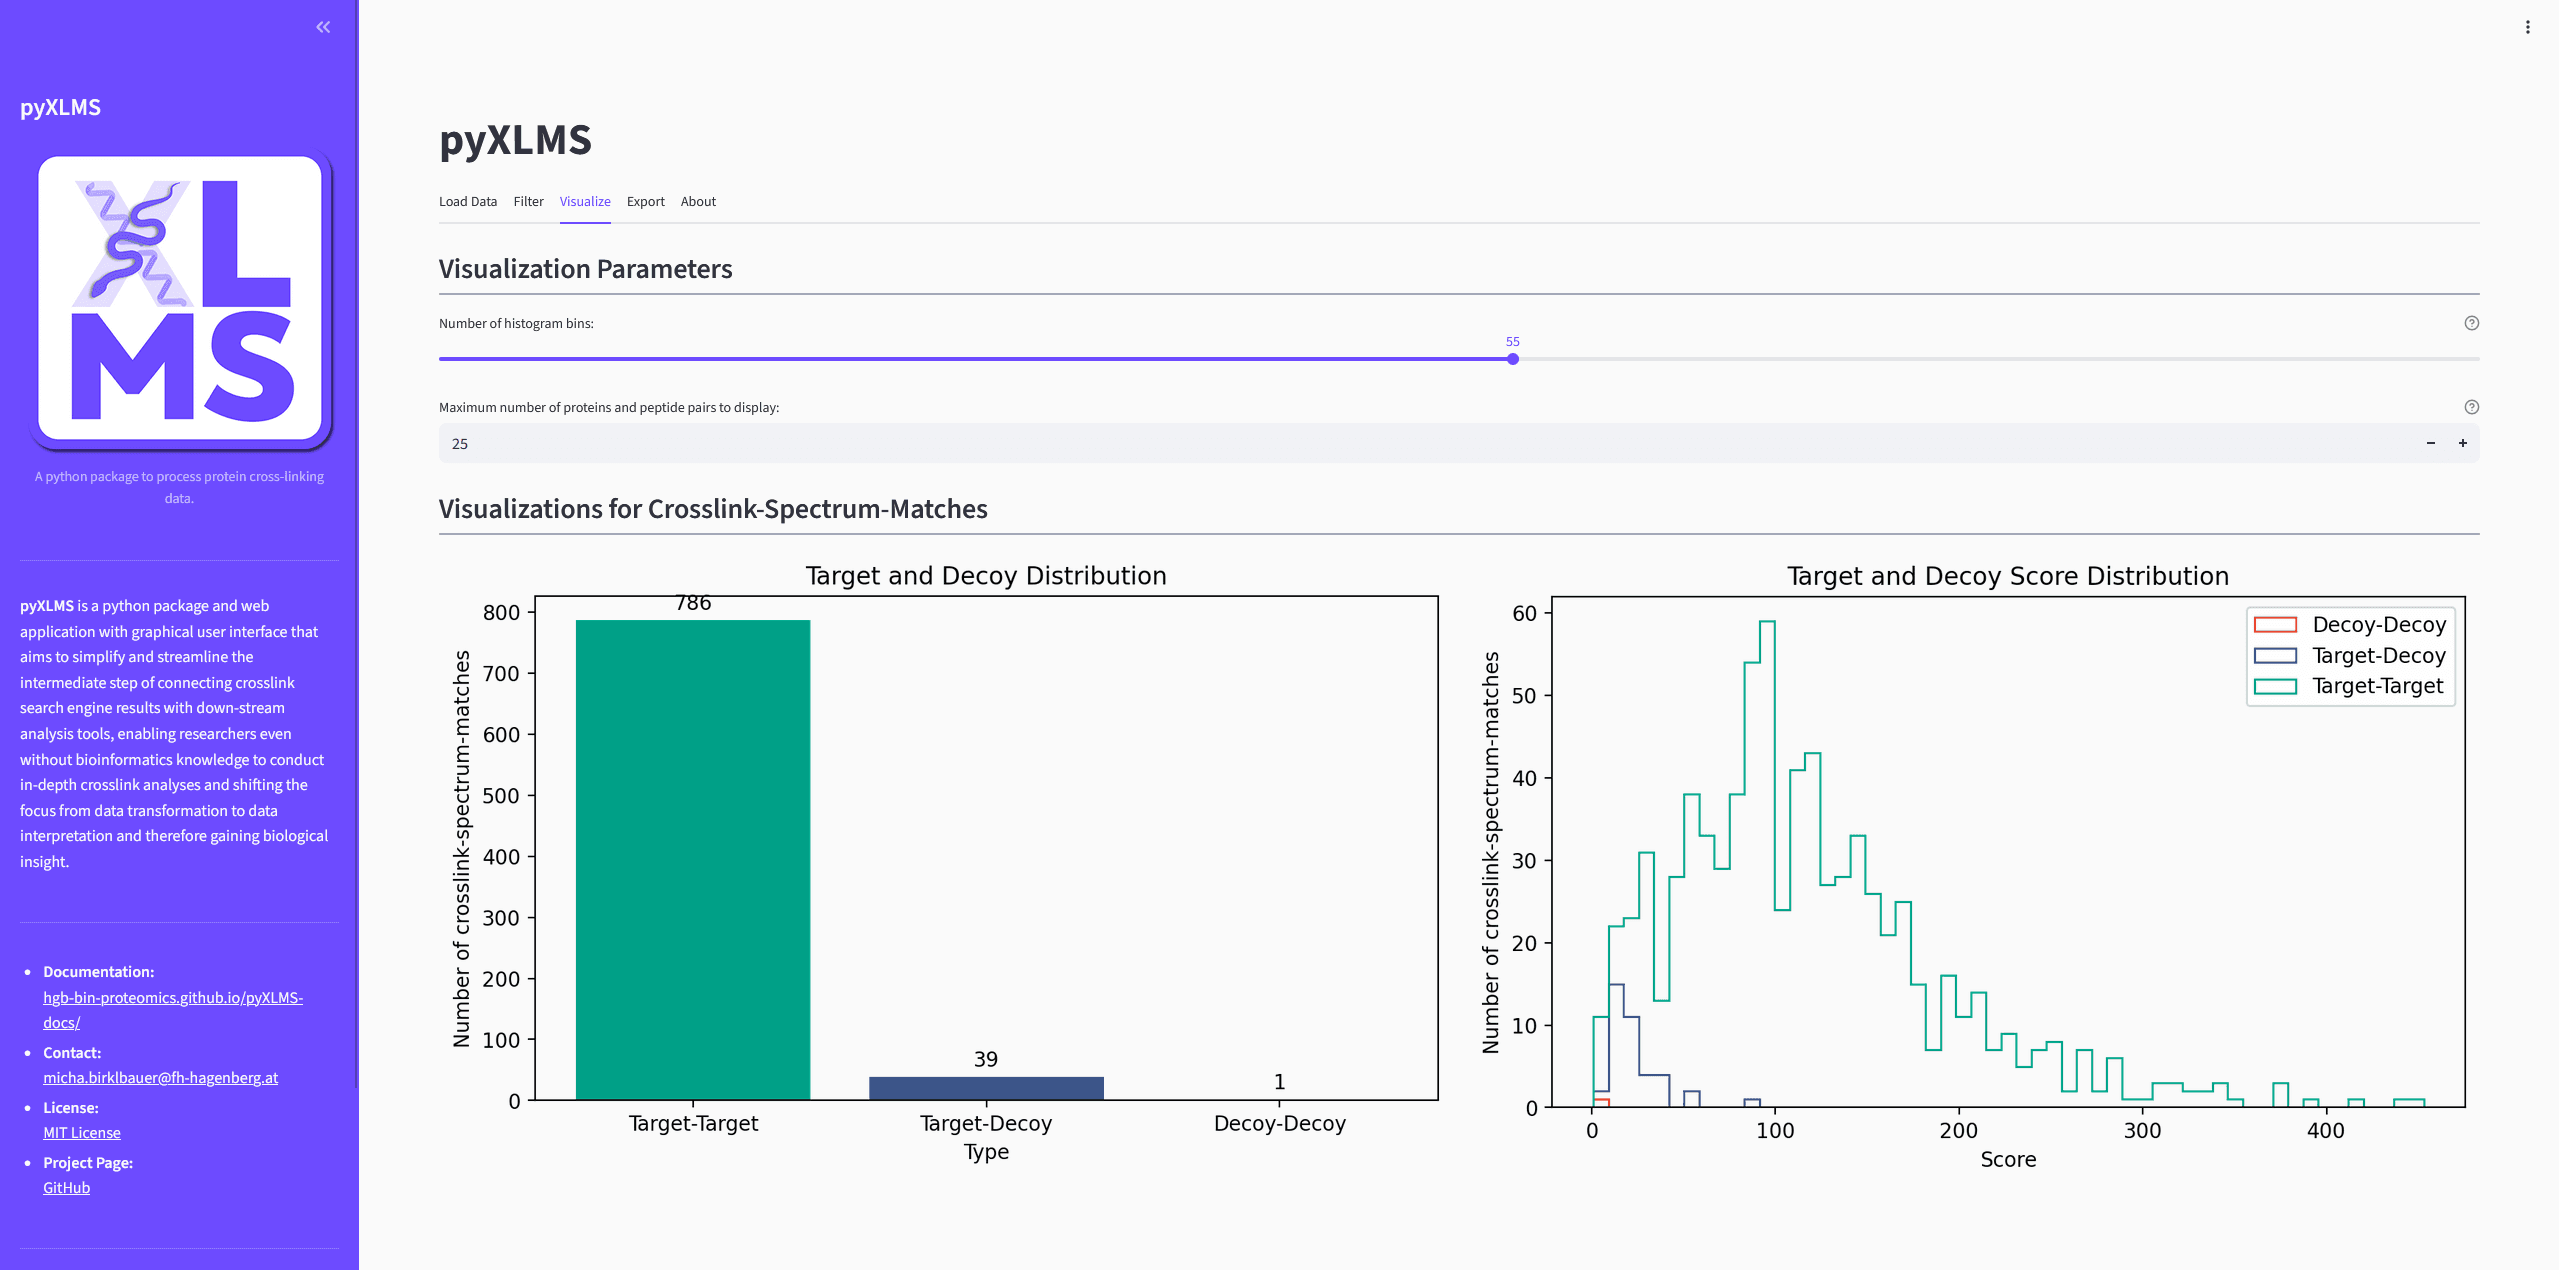
- The
Target and Decoy Distributionplot will show the number of “Target-Target”, “Target-Decoy” and “Decoy-Decoy” matches in your results. - The
Target and Decoy Score Distributionplot will show the score distribution of “Target-Target”, “Target-Decoy” and “Decoy-Decoy” matches in your results.
- The
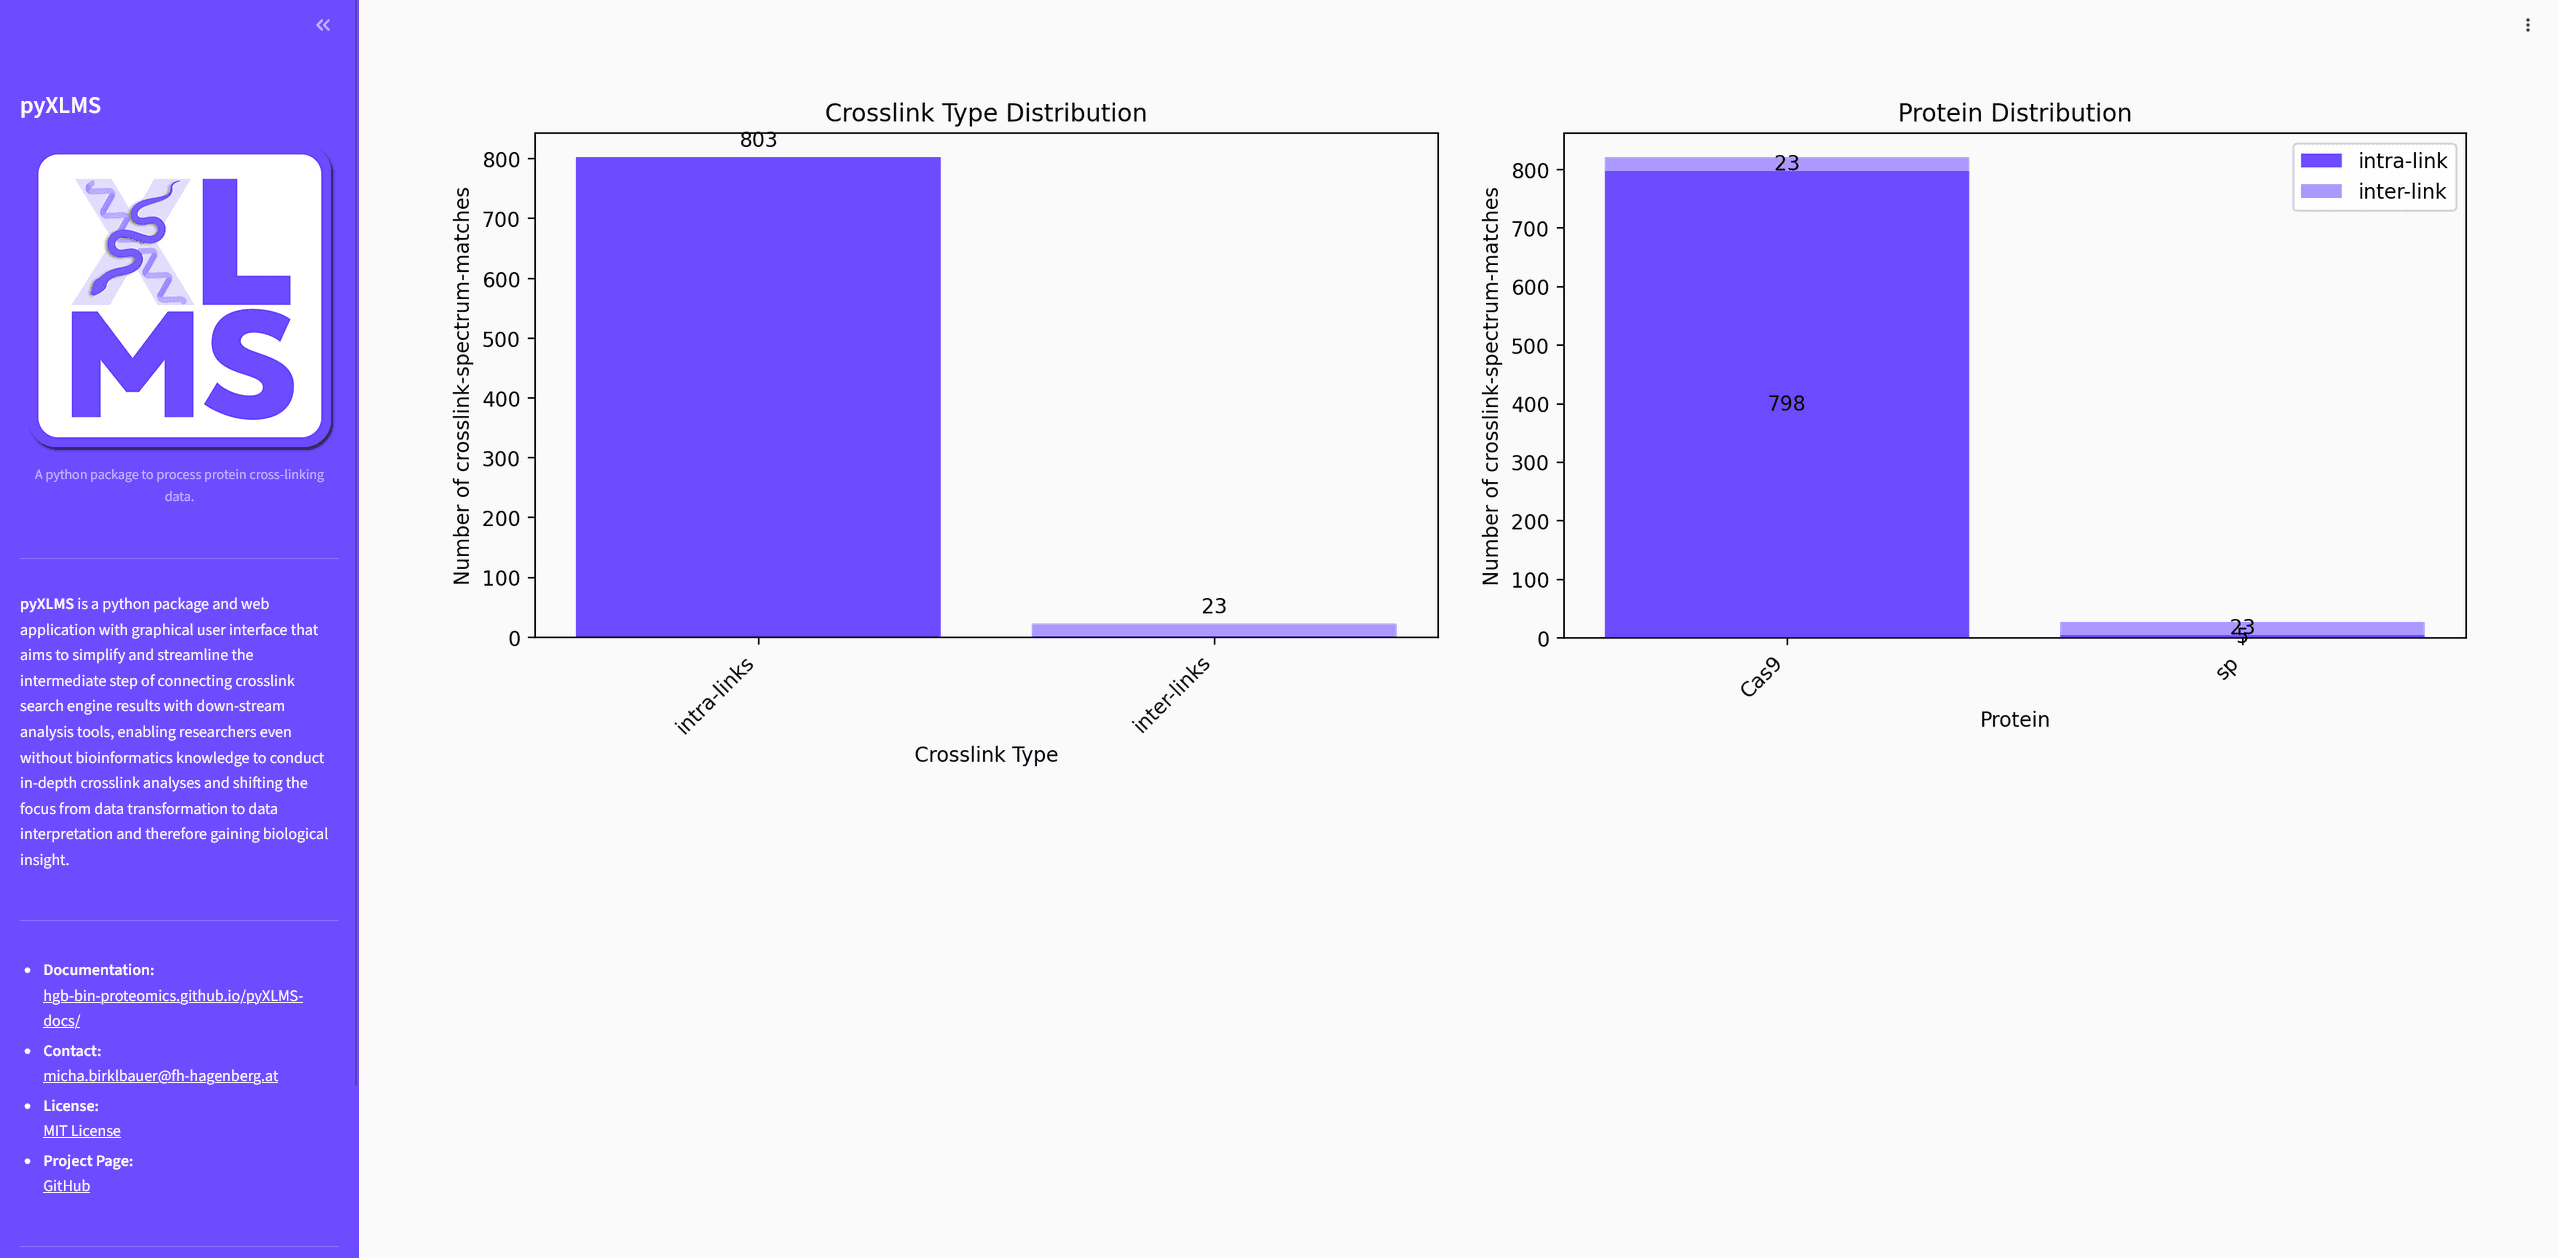
Crosslink Type Distributionplot will show the number of intra- and inter-links in your results. - The
Protein Distributionplot will show the topnproteins with the most crosslink evidence in terms of number of CSMs/XLs. It additionally shows the number of intra- and inter-links per protein. Thenparameter is controlled via theVisualization Parameterssection at the top of the page.
- The
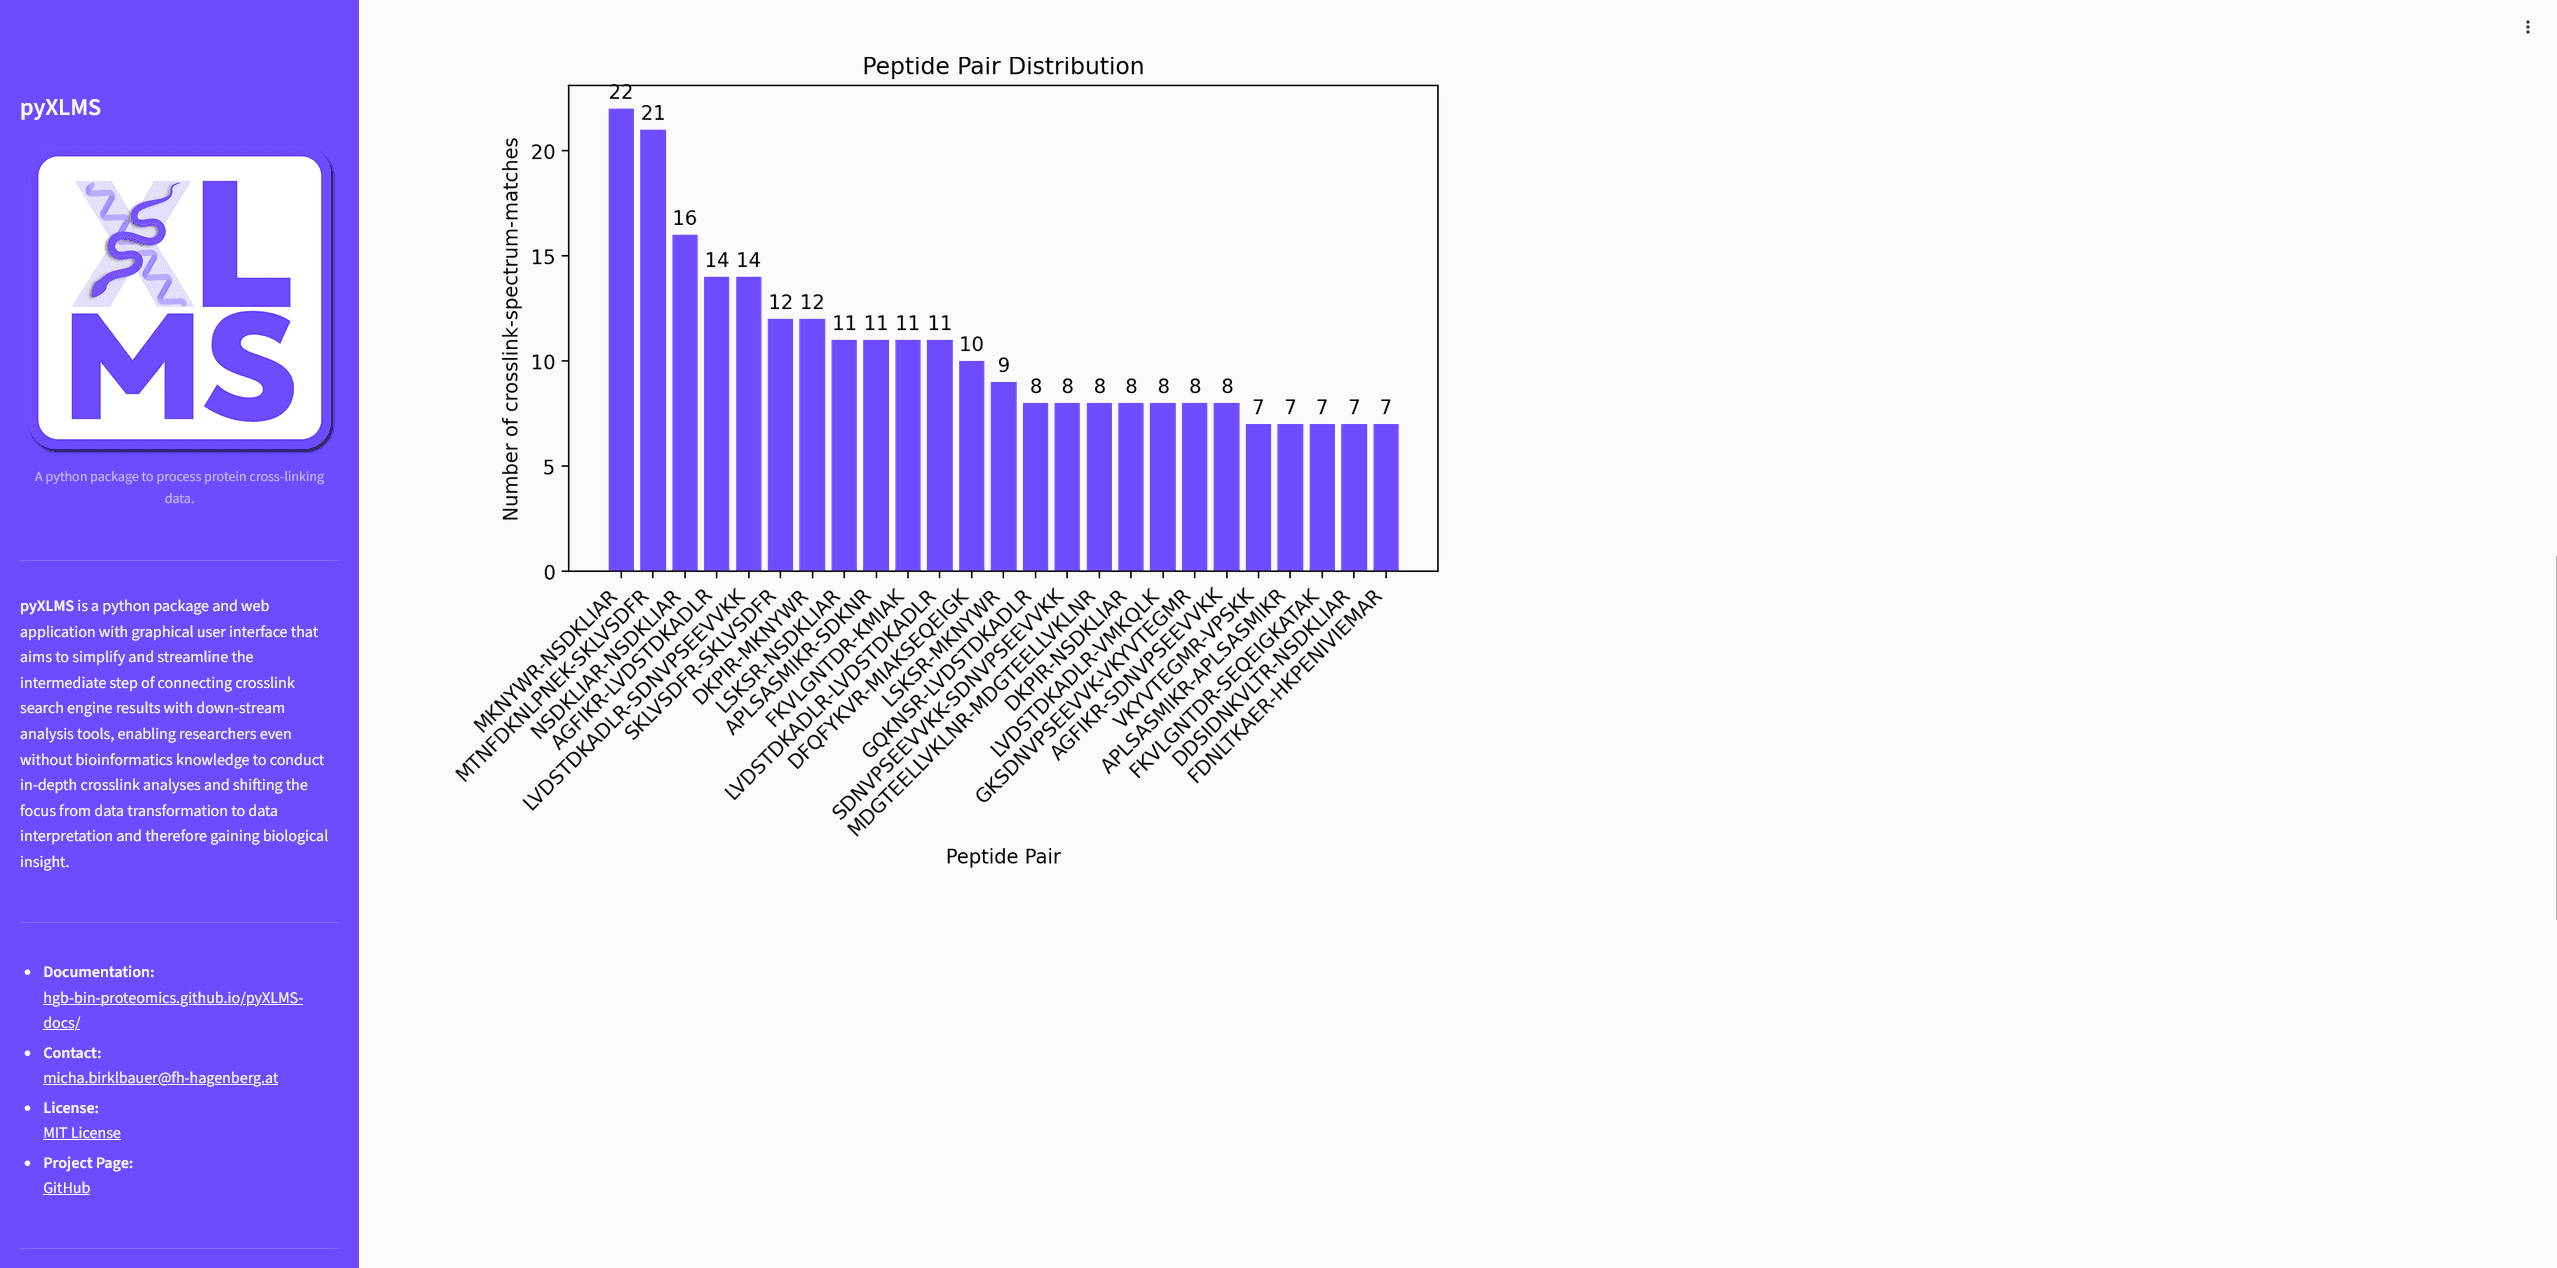
Peptide Pair Distributionplot is only available for CSMs and show the most frequently observed peptide pairs in your CSMs.
Last updated on